HL Paper 2
The diagram shows some of the factors affecting vulnerability to hazards.
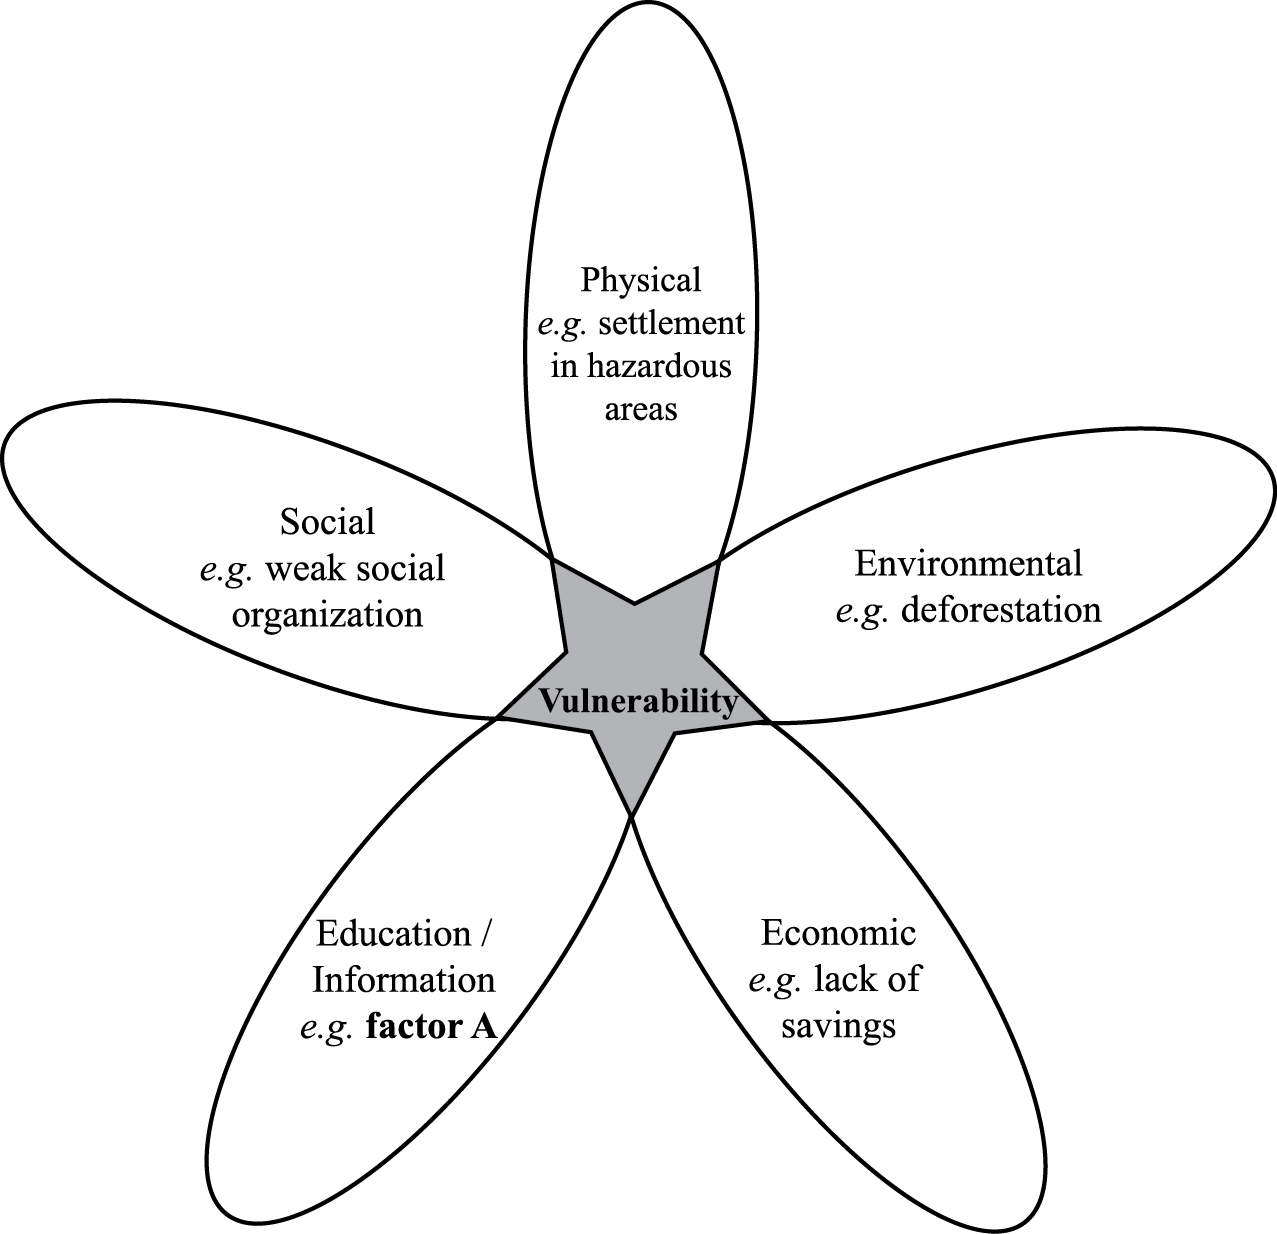
[Source: Richard Rhoda and Tony Burton. Mexico: A geographic perspective, Sombrero books (2009)]
Suggest what factor A on the diagram might be.
Explain how two of the other factors (other than factor A) shown on the diagram affect vulnerability to hazards.
Analyse why communities may underestimate the probability of a hazard event occurring.
For one or more hazards of your choice, examine how estimates are made for the probability and likely impact of a major hazard event.
Describe two ways in which land-use planning (zoning) can reduce hazard risk for a named hazard type.
Explain three reasons why people continue to reside in areas that are known to be affected by hazards.
“Hazard events are predictable, disasters are not.” Discuss this statement.
(i) Describe what is meant by hazard risk.
(ii) Describe what is meant by vulnerability to hazards.
Explain how building design and land-use planning can limit the potential damage from one named hazard type.
“The faster the speed of onset, the greater the impact of the hazard event.” Discuss this statement, with reference to examples.
Describe the global distribution of either volcanoes or earthquakes.
Suggest three factors that might affect an individual’s perception of the risk posed by tectonic hazards.
“Hazard prediction is ineffective in reducing the impact of hazard events on people’s lives and property.” Discuss this statement, with reference to two different hazard types.
Referring to either earthquakes or volcanoes, briefly outline:
(i) one scale used to measure the magnitude of the hazard event;
(ii) why some hazard events are categorized as disasters.
Referring to either earthquakes or volcanoes, briefly explain their occurrence:
(i) at a destructive (convergent) plate margin;
(ii) in areas other than along a plate margin.
Discuss why some hazard events are easier to predict than others.
Identify a scale used to measure the magnitude of one hazard type.
Describe the main features of the scale you identified in (a)(i).
Explain the occurrence of hurricanes (tropical cyclones, typhoons) in a named area.
“The economic impact of disasters is increasing while related deaths are decreasing.” Discuss this statement, with reference to examples of disasters.
Outline the methods used to describe the magnitude (strength) of two hazard types.
Suggest three reasons why some people continue to live in places with a known hazard risk.
“Economic factors and not physical factors determine the severity of the impacts of hurricanes (typhoons, cyclones).” Discuss this statement using examples.
The diagram shows three natural hazards (A, B, C), their duration and the size of the area they affect.

Identify two of the hazards shown and explain your choice.
Analyse the global distribution of one of the hazards you identified in part (a).
Using examples, evaluate the success of adjustment and response strategies for a named hazard type.
The graph shows the number of people, and the percentage of the total population, exposed to drought in different countries in an average year.

[Source: Reducing Disaster Risk – UNDP/BCPR, UNEP/GRID-Geneva]
Briefly describe any two distinct patterns shown by the data on the graph.
Explain the reasons for the occurrence and severity of a specific drought event that you have studied.
Referring to examples, examine why the geographic impacts of disasters vary in space and time.
The map shows the world distribution of severe drought events from 1974 to 2004.

[Source: http://www.preventionweb.net/files/10600_Figure226.jpg; ©UNEP/GRID]
Describe the distribution of areas in the northern hemisphere that have been affected by five or more severe drought events from 1974 to 2004.
Analyse three ways in which communities can reduce the impact of drought.
“Hazard preparedness is more important than hazard prediction.” Discuss this statement with reference to any one hazard other than drought.
The graph shows the cost of hazard events worldwide in US dollars from 1960 to 2004.

[Source: NASA Earth Observatory, http://earthobservatory.nasa.gov/Features/RisingCost/]
Describe the changes shown in the graph.
Explain the reasons for the changes shown in the graph.
Examine the different types of responses that occurred during and after a named disaster. (Do not refer to technological hazards in your answer.)
(i) Describe what is meant by the term “drought”.
(ii) Outline one climatic reason for the occurrence of one named drought.
Referring to either earthquakes or volcanoes, explain three reasons why fewer deaths are caused by these hazards than in the past.
Using located examples, examine why the intensity of hurricanes varies over time.
Outline two factors that can influence the vulnerability of a community to the impacts of a tectonic hazard event.
Briefly explain the occurrence of either volcanoes or earthquakes at constructive plate margins.
Briefly explain the occurrence of either volcanoes or earthquakes at destructive plate margins.
Examine the effectiveness of short- and long-term responses to one recent disaster caused by a hurricane (tropical cyclone/typhoon).
The diagram shows the structure of a typical hurricane (typhoon, tropical cyclone) in the northern hemisphere.

[Source: http://library.thinkquest.org/03oct/00758/en/disaster/hurricane/structure.jpg]
Describe the atmospheric conditions in the eye and the eyewall of a typical hurricane.
Explain the conditions needed for the occurrence of a hurricane hazard event.
“Rich countries experience hazard events while poor countries experience disasters.” Discuss this statement with reference to one named hazard type.
Define hazard risk.
Define hazard probability.
Explain three factors that affect the way that people perceive hazards.
Examine the impact of a recent human-induced (technological) hazard event.
The map shows the Cape Hatteras area of the east coast of the USA. The satellite image shows Hurricane Irene (2011), a few days before it reached Cape Hatteras.
(i) State the height in metres of the highest point west of gridline 35.
(ii) State the four-figure grid reference for the square in which this point is located.
(iii) State the shortest distance by road, in kilometres, between the school and the ferry at Cupola.
Using map evidence only, explain why the inhabitants of this area were particularly vulnerable to the impacts of Hurricane Irene.
“The level of economic development is not the main factor affecting the impact of a tectonic hazard event on a community.” Discuss this statement, with reference to either earthquakes or volcanoes.
Explain three conditions necessary for the formation of tropical hurricanes.
“Poorer communities are more vulnerable to the impacts of hazard events than richer communities.” Discuss this statement.
(i) Define the term disaster.
(ii) Outline two long-term actions a community can take to reduce the economic impact of hurricanes.
Explain the causes of one named human-induced hazard event.
Examine the reasons why people continue to live in areas that have been affected by severe drought hazard events.
Describe the difference between a hazard and a disaster.
Explain why some sections of a community are more vulnerable to hazards than others.
Compare the effectiveness of the methods used to predict the occurrence of two different natural hazard types.
The diagram shows changes in population and vulnerability for a city at risk of multiple natural hazards, between 1915 and 2015.

Using data from the diagram, describe three trends shown.
Suggest how a community’s vulnerability to hazards is affected by:
(i) the demographic characteristics of its population;
(ii) the socio-economic characteristics of its population.
Using examples, contrast the strategies adopted to minimize the risk from future droughts and hurricanes.
The map shows the impacts of Hurricane Sandy on selected states in the Eastern United States in 2012.

(i) Using map evidence, determine which state was worst affected and outline why.
(ii) Using map evidence, determine which state was least affected and outline why.
(iii) Suggest how land-use planning (zoning) could help reduce vulnerability to hurricanes in this area.
Suggest why the distinction between a hazard event and a disaster is not always completely clear.
Referring to two or more types of hazard, examine why the highest magnitude hazard events are not necessarily the most harmful.
The diagram shows the total number of people affected by different types of hazard event between 2002 and 2012.

Identify which hazard:
(i) affected the least number of people in 2012;
(ii) affected the greatest number of people between 2002 and 2012.
Suggest two reasons why the number of people affected by storms in 2012 is lower than in previous years.
Explain what is meant by the:
(i) rehabilitation response to a hazard event;
(ii) reconstruction response to a hazard event.
Examine why some areas of the world have a high hazard risk for either earthquakes or volcanoes
The chart shows the total number of hurricanes that struck a country per decade from 1851 to 2010.

Describe the trends shown on the graph.
(i) Outline the essential characteristics of drought.
(ii) Explain the cause(s) of one named drought event.
“The level of economic development is the most important factor that influences the vulnerability of a population to environmental hazard risks.” Discuss this statement.
The diagram shows how an earthquake or volcanic eruption impacts on a population’s quality of life.

With reference to either earthquakes or volcanic eruptions, describe two ways in which people’s quality of life deteriorates at point A on the diagram.
With reference to either an earthquake or a volcanic eruption, distinguish between the types of response to the hazard event that occur at point B and point C on the diagram.
“Improved building design is the most effective way for people to reduce their vulnerability to hazards.” Discuss this statement.
Diagram A shows the number of reported disasters by decade by hazard type, globally. Diagram B shows economic losses by hazard type, globally.


(i) Describe the change in the total number of reported disasters between 1971 and 2010.
(ii) State the type of natural hazard that has not increased in frequency since 1981.
(iii) Estimate the total economic losses due to storms and floods between 1971 and 2010.
Explain three reasons why communities may underestimate the probability of a major hazard event occurring in the area in which they live.
Discuss the view that human vulnerability to natural hazards (excluding river flooding) is greater in urban areas than in rural areas.
The map shows the global pattern of hurricane (tropical cyclone, typhoon) tracks.

Describe the distribution and tracks of hurricanes (tropical cyclones, typhoons) affecting mainland Asia.
Briefly explain two geographical consequences of a recent human-induced (technological) hazard.
Using one or more recent examples, discuss the relative importance of short-term and long-term responses to hazard events and/or disasters.
The map shows the population exposed to tectonic hazards in south and east Asia.

Describe the pattern of high population exposure to tectonic hazards shown on the map.
Suggest three reasons why communities often underestimate the probability of a tectonic hazard event occurring in their locality.
Examine the ways in which vulnerability to either earthquake or volcanic hazards can be reduced.
Optional Theme D — Hazards and disasters – risk assessment and response
7. The map shows the track of Hurricane Charley in August 2004 and changes in the intensity of the storm. Dates are also shown.

Describe the changes shown from 12 August to 14 August in:
(i) storm intensity;
(ii) storm direction.
Explain two factors that affect the formation and development of hurricanes.
Using examples, examine the demographic and socio-economic factors that affect the vulnerability of a community to hazard events.
The map shows Marrakech and the surrounding area. The scale of the map is 1:160 000 and the contour interval is 40 metres.


[Source: Marrakech topographical map. Reproduced with permission of EWP]
Marrakech is located in a semi-arid agricultural area, with an average rainfall of 281 mm/year, mainly falling between October and May. The area is prone to droughts, which have become more frequent in recent years.
State the height in metres of the highest point north of the Oued Tensift river.
State the four-figure grid reference for this point.
Briefly describe the distribution of fruit farming areas shown on the map.
Explain two possible human impacts that could occur as a result of a long-term drought in the area shown on the map.
Suggest one short-term strategy that the local community could use to help overcome the problem of drought in the area shown on the map.
Examine the reasons why people continue to live in areas affected by frequent earthquake or volcanic activity.